Every asset has
a fair price.
Real Charts shows it — fair value zones, filtered entry signals, and price targets. One overlay on TradingView.
Value Zone
Dynamic fair value range
Entry Signals
Multiple conditions aligned
Price Targets
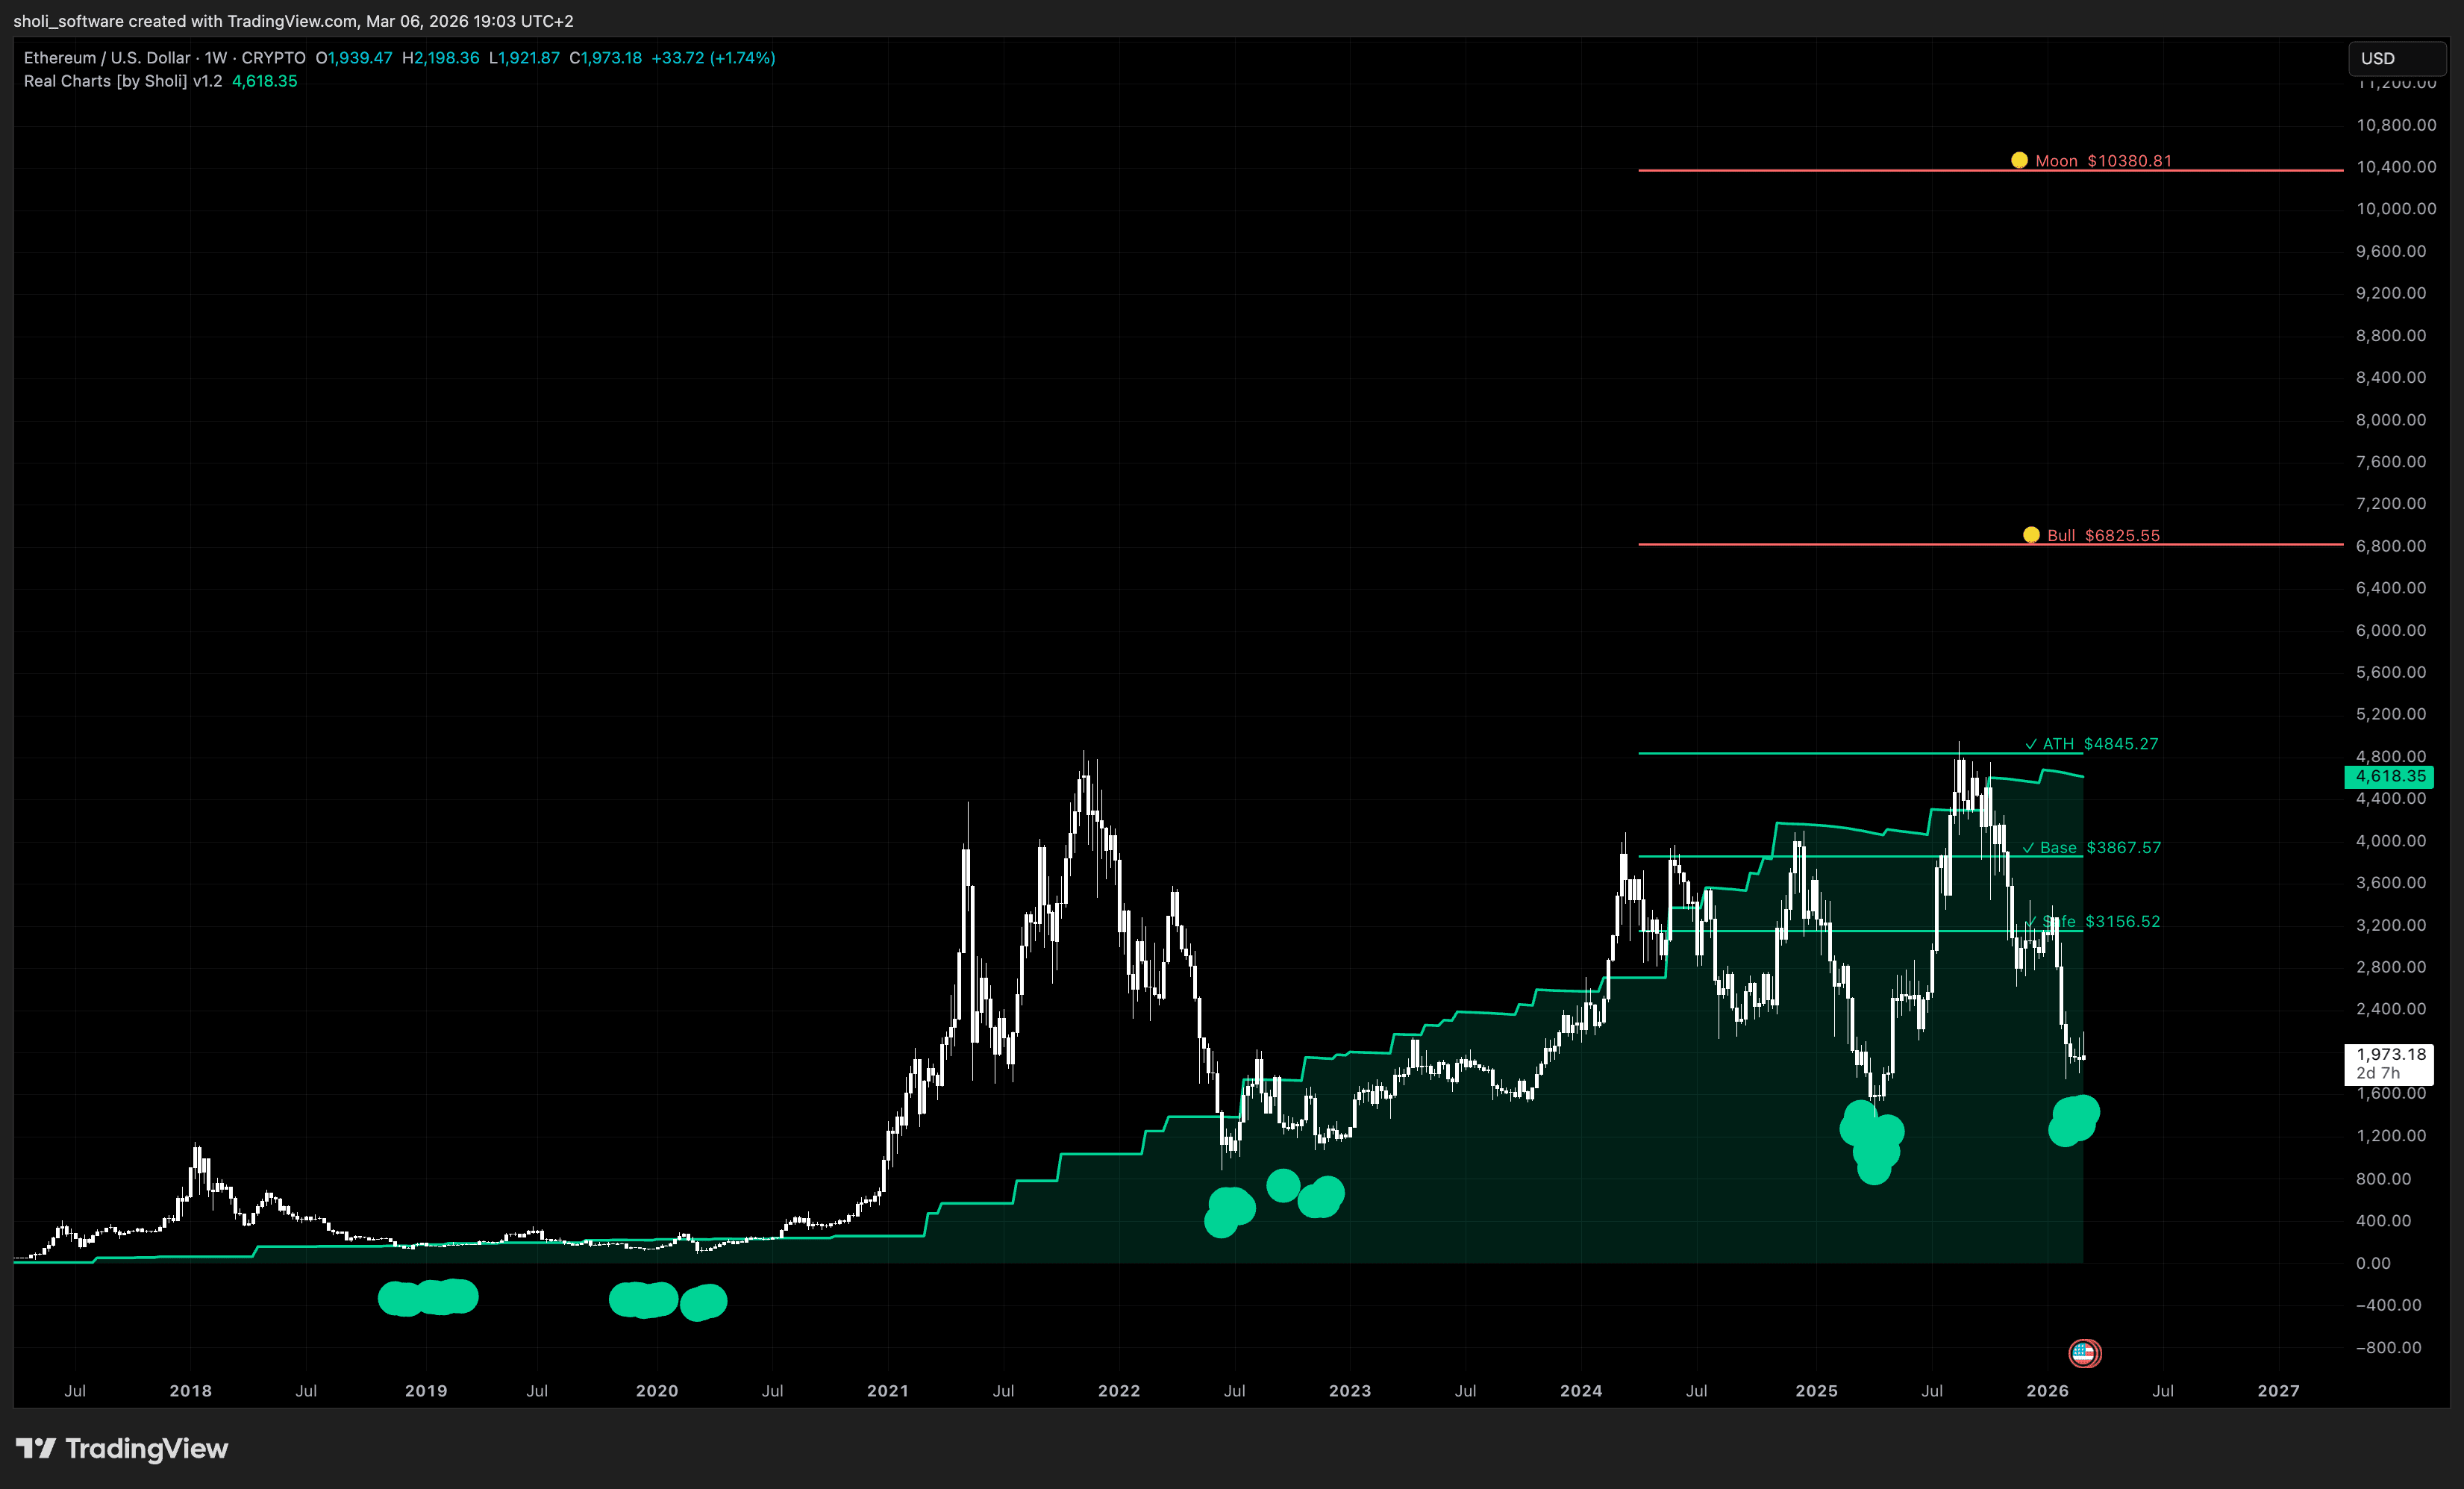
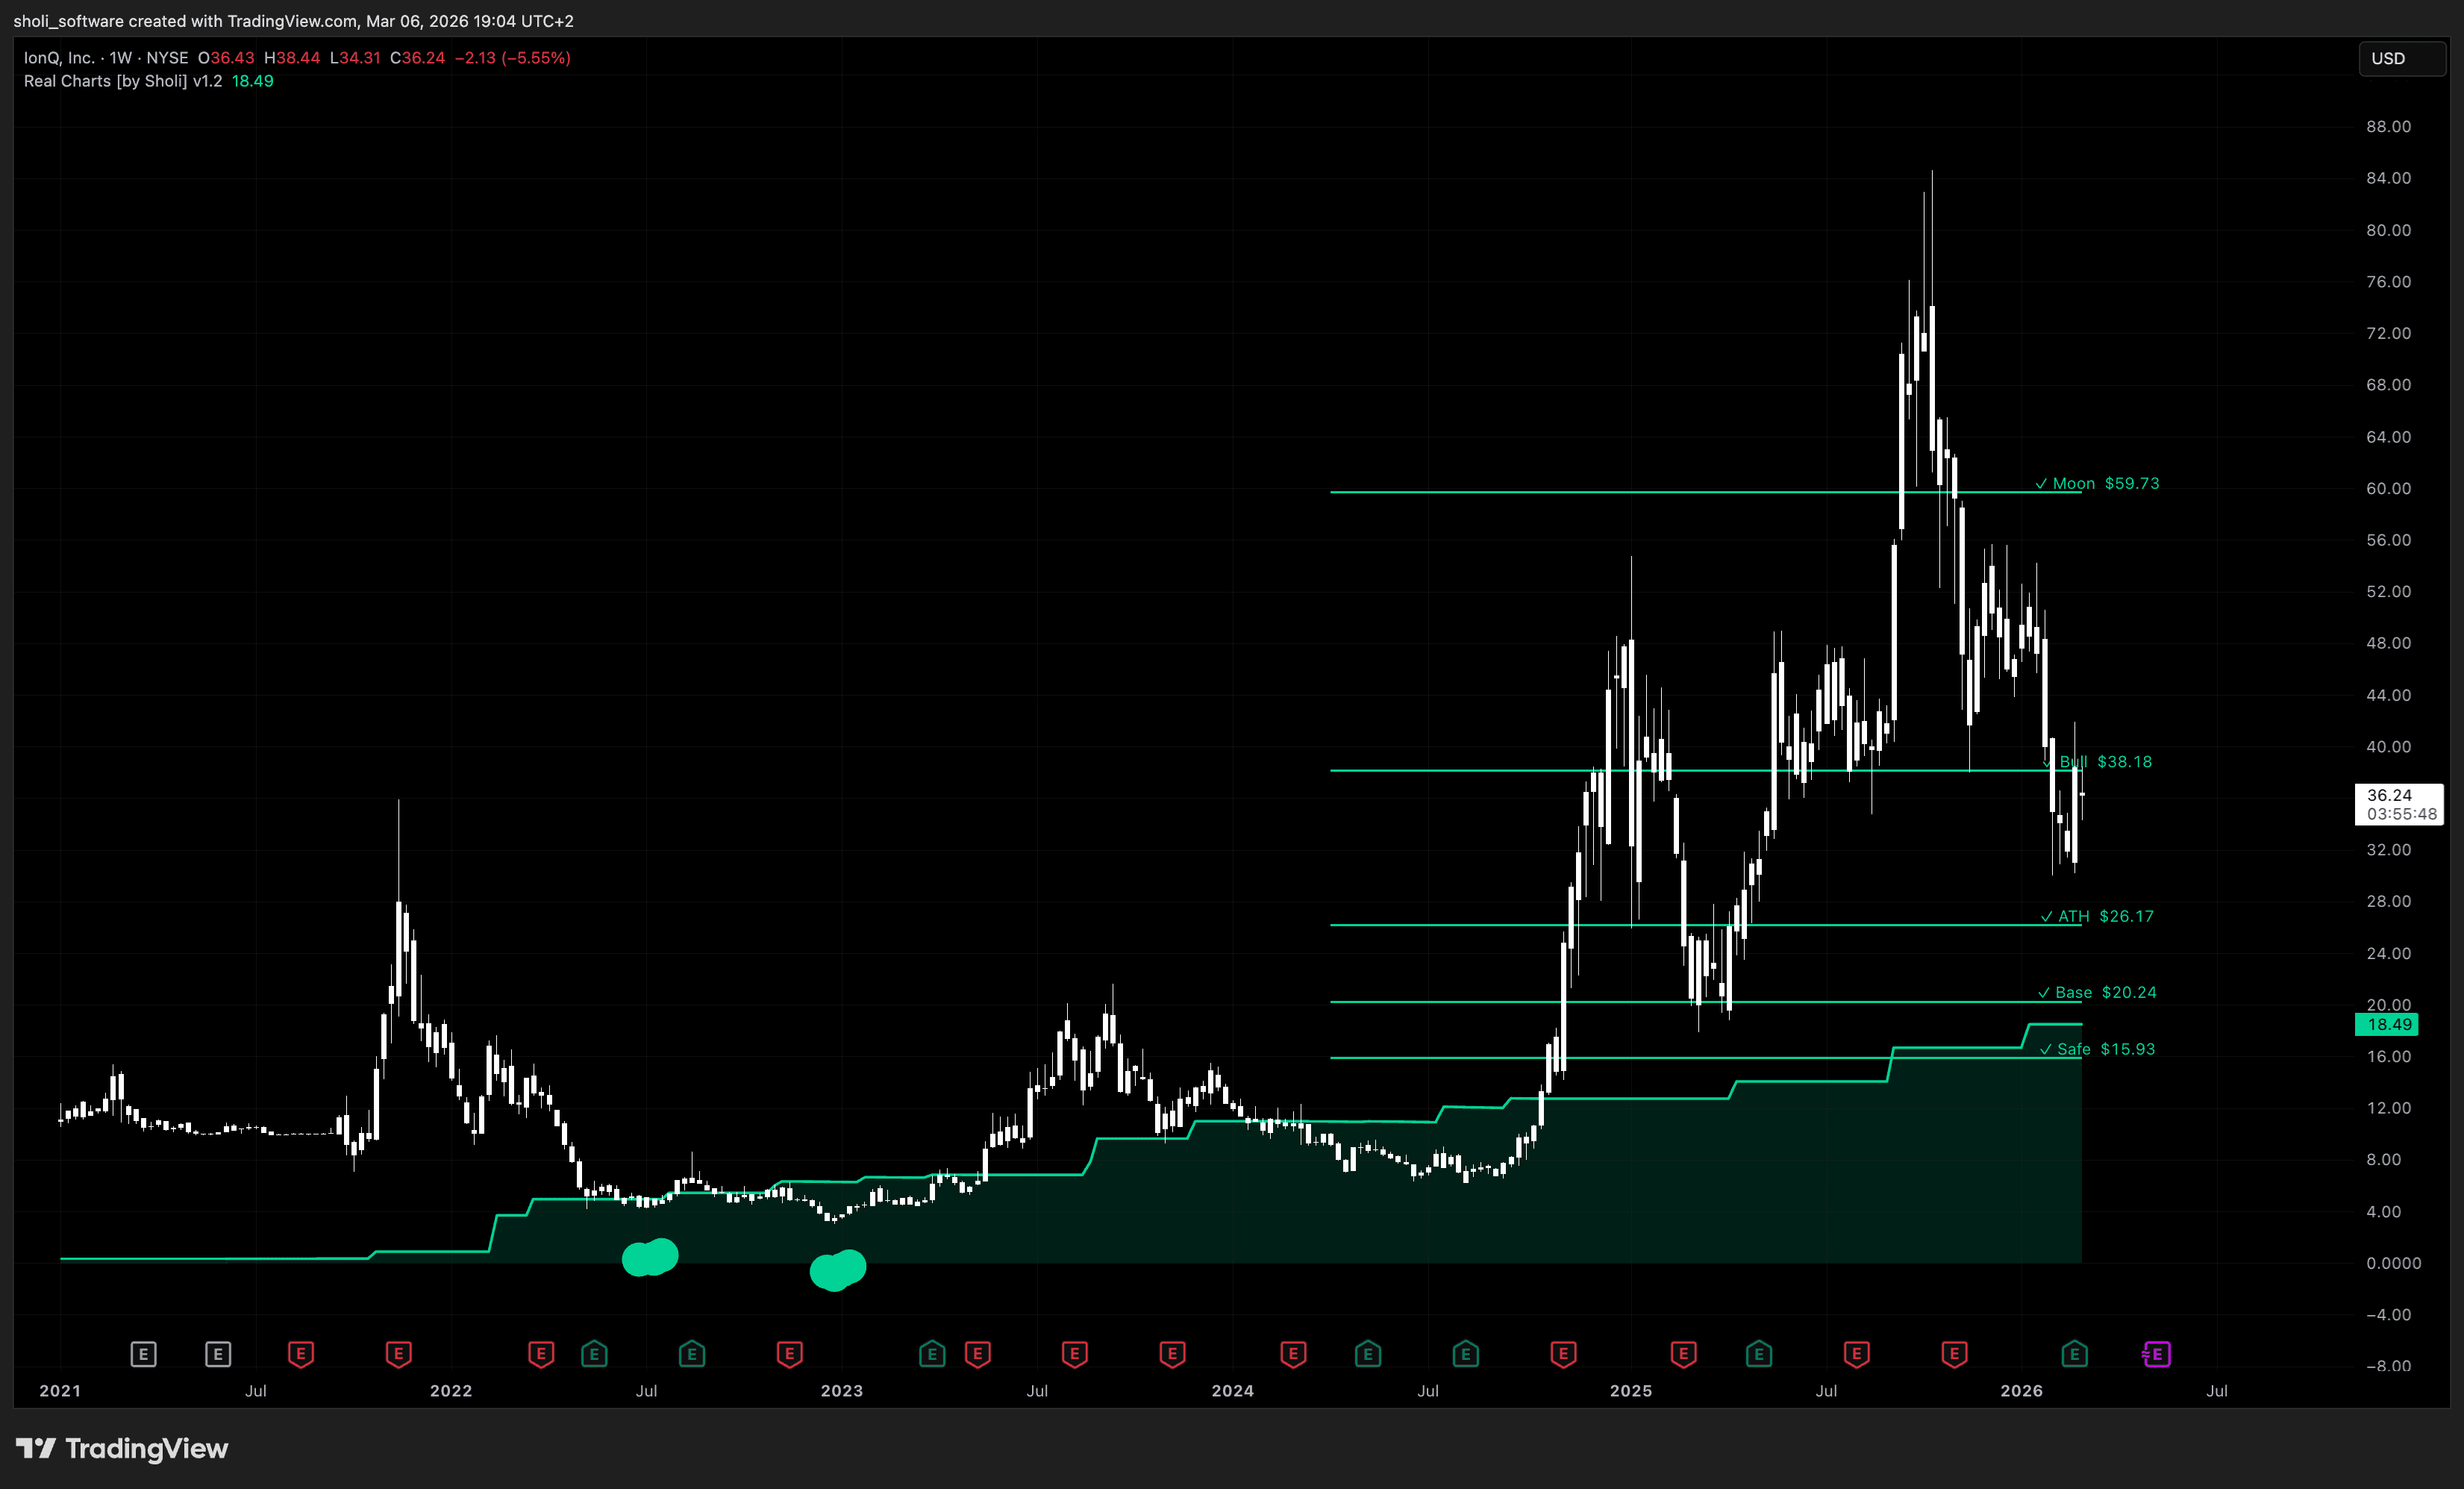
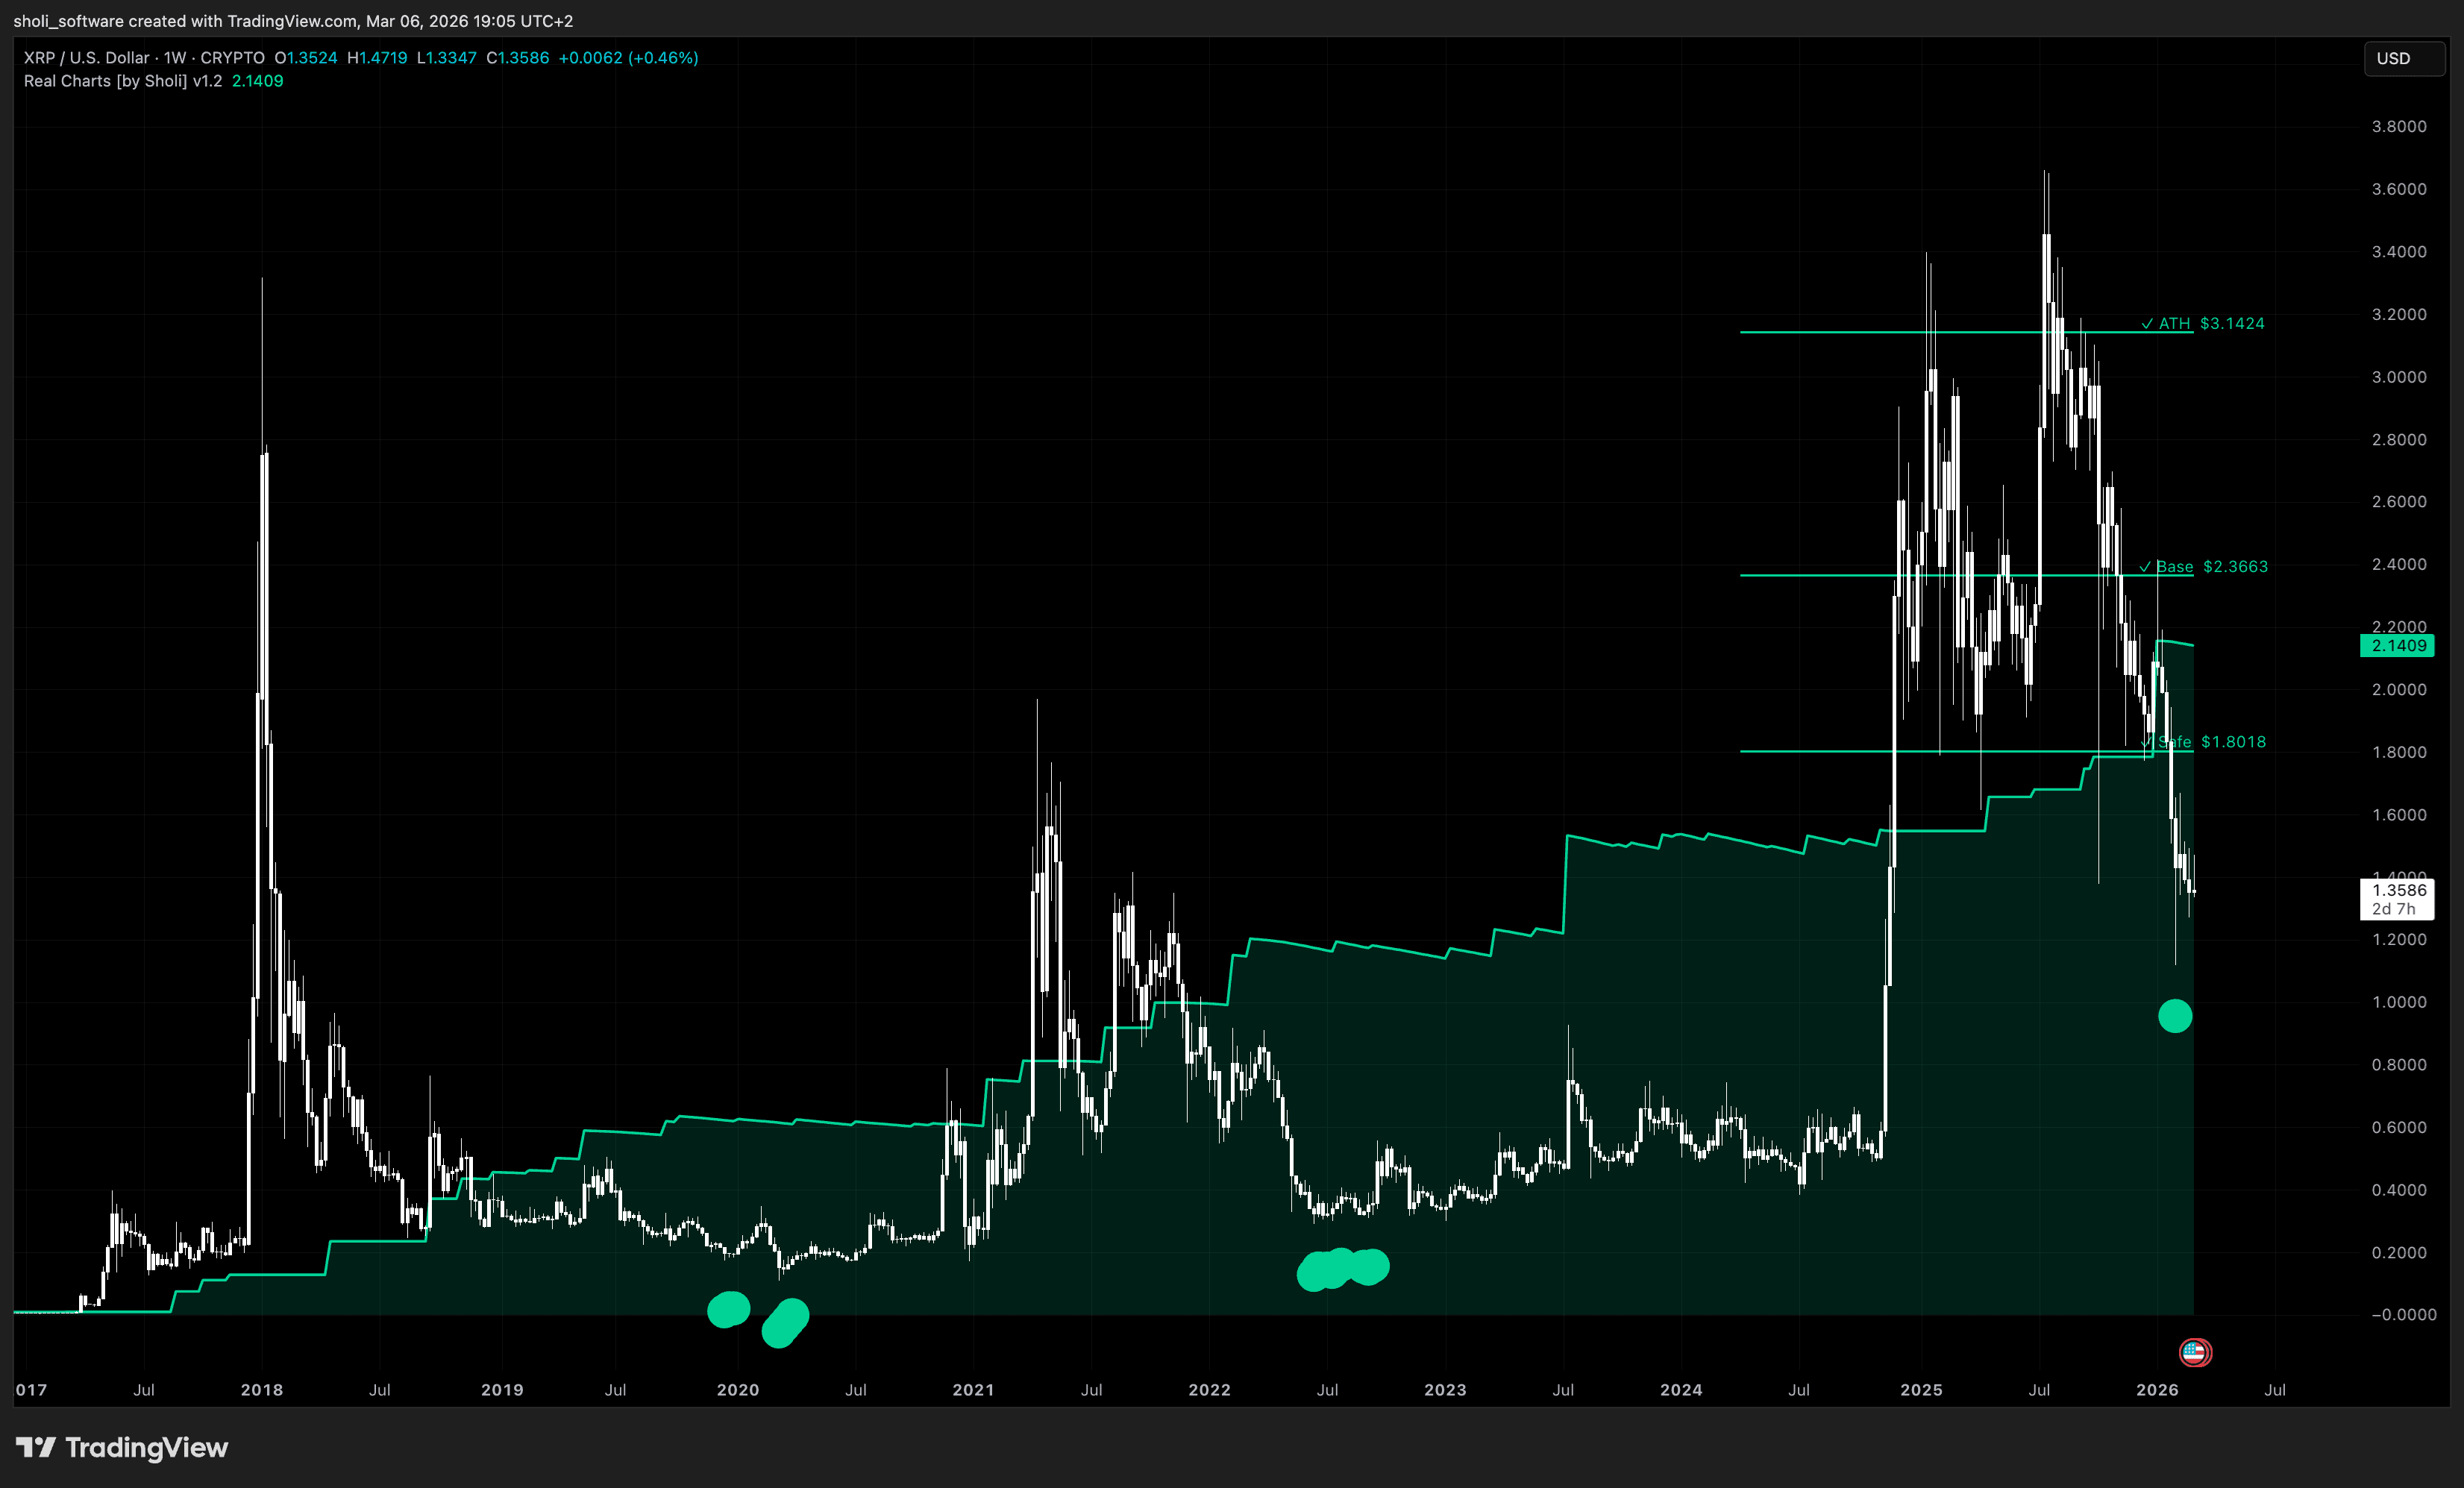
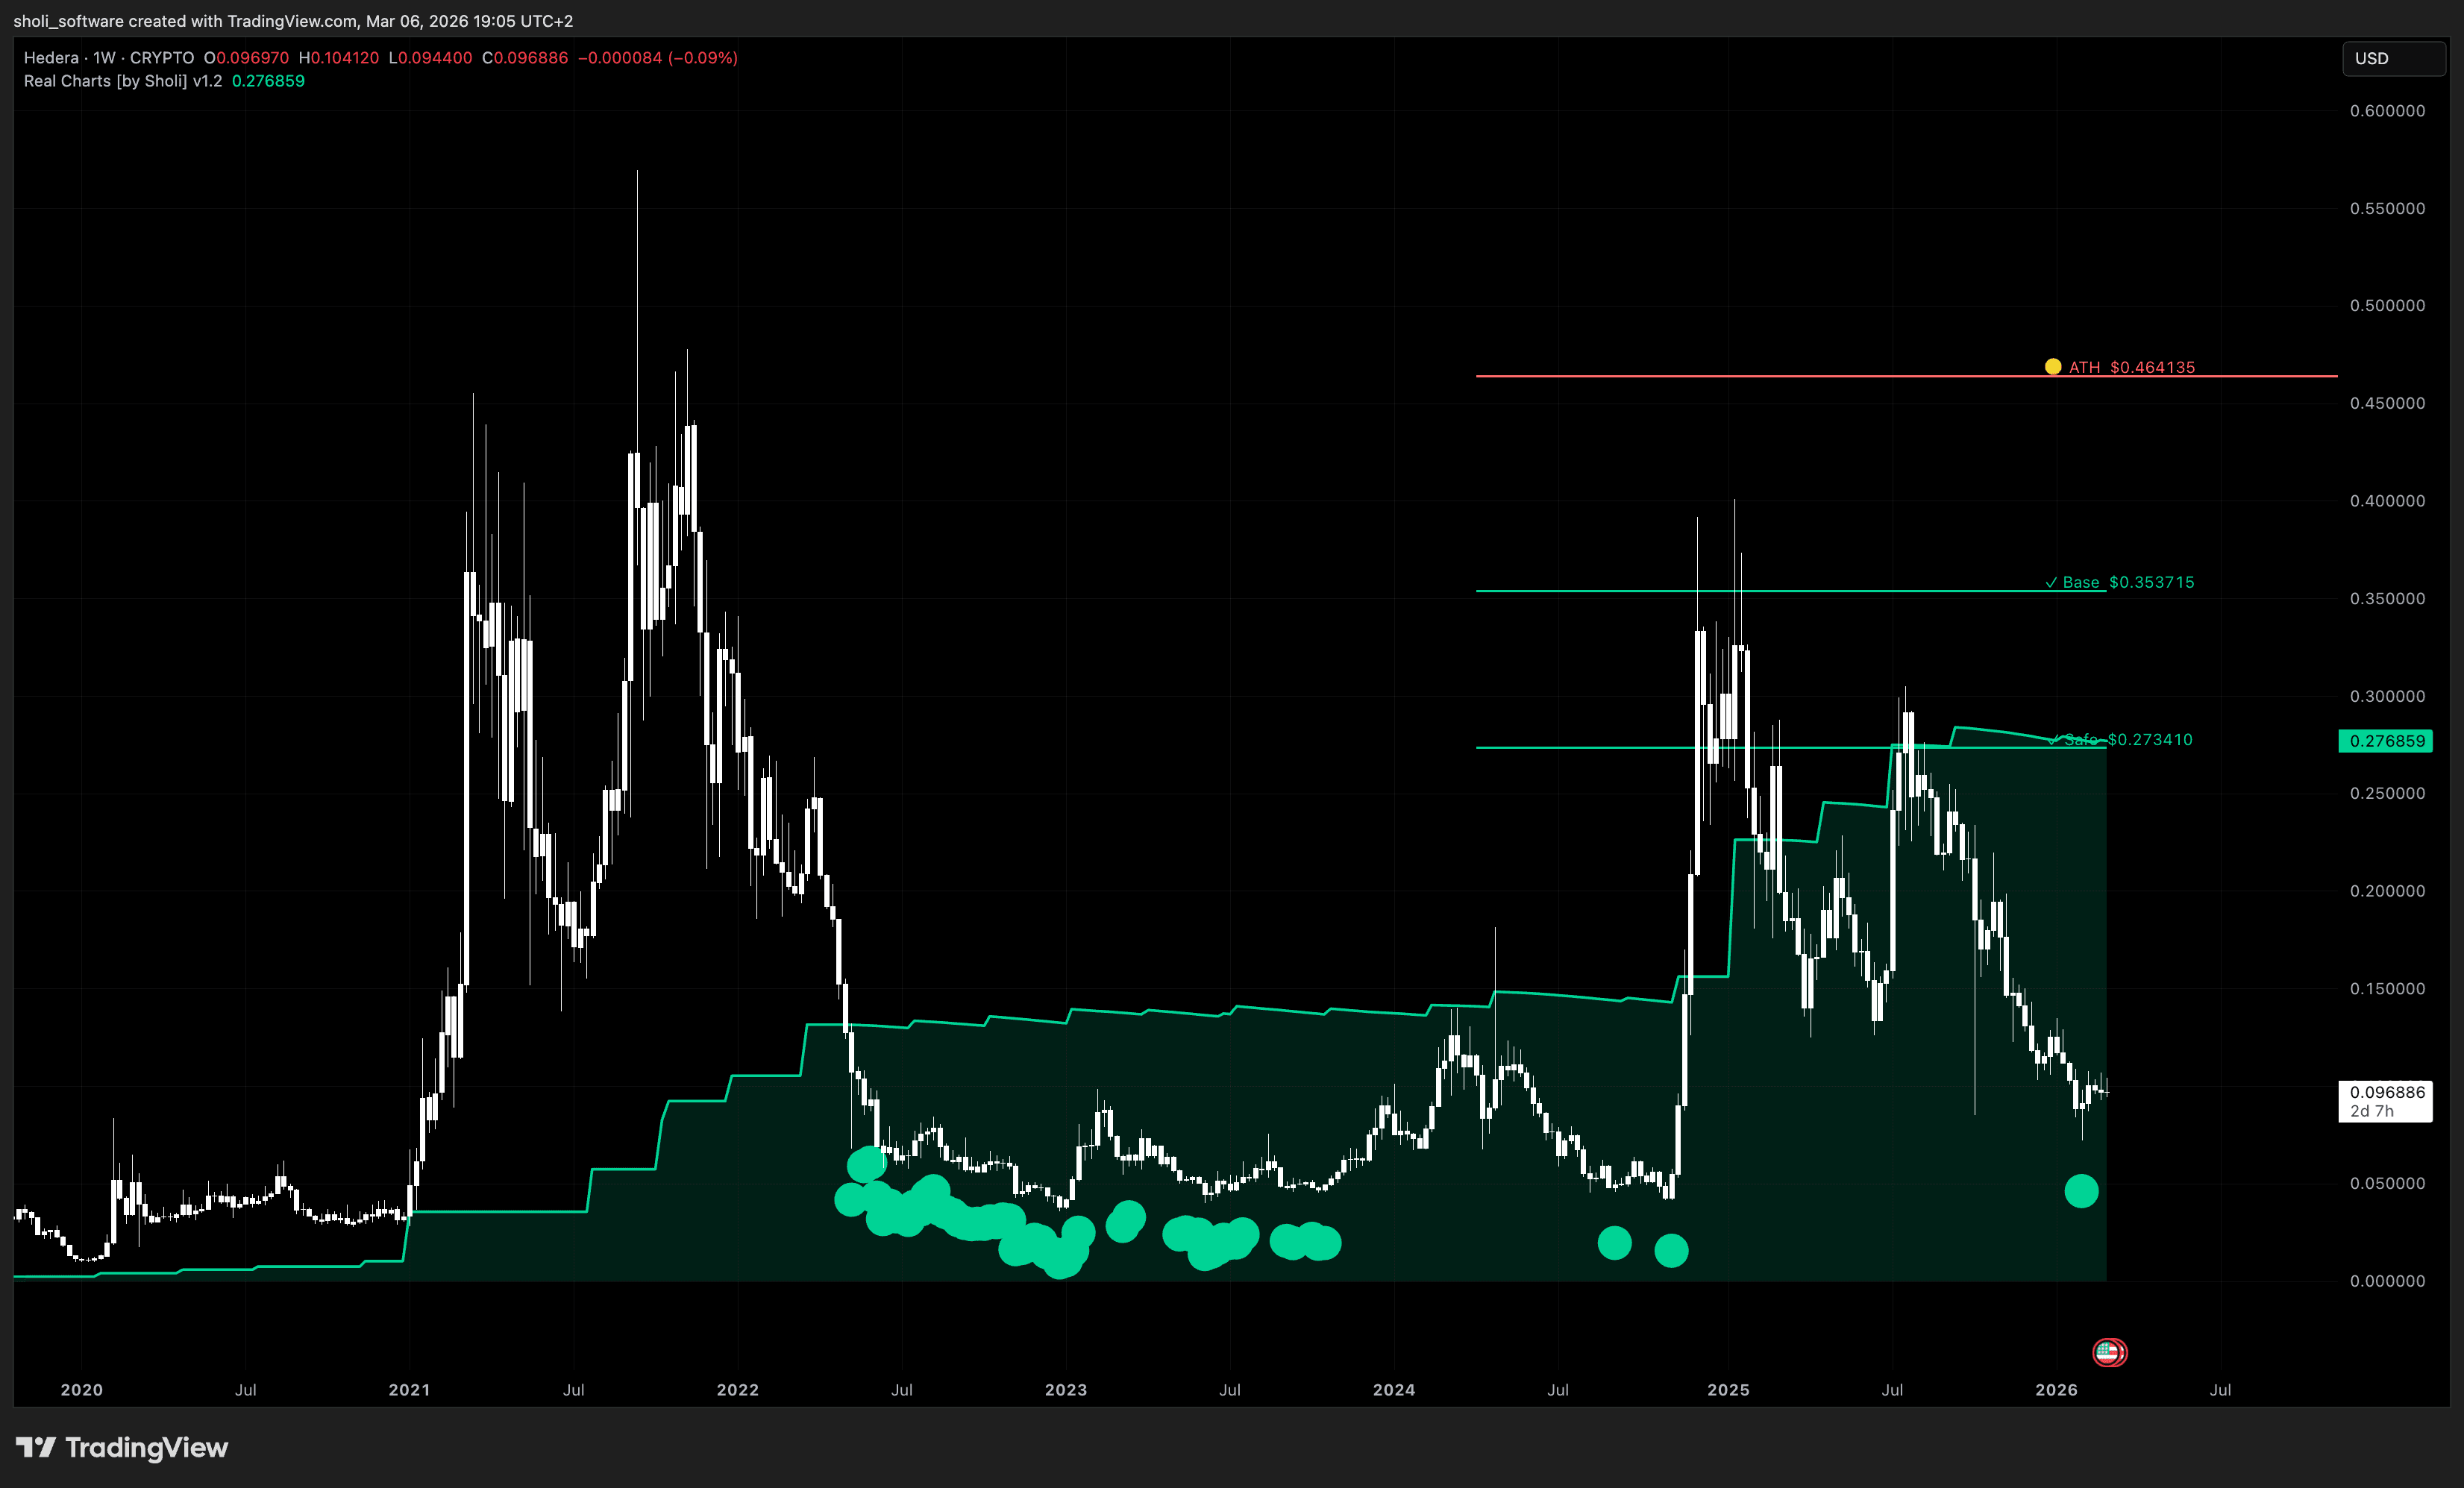
Safe, Base, ATH, Bull, Moon
Fair Price Line
Upper edge of the zone
Zone. Signal. Target.
One overlay — three types of information. Here's how you read it.
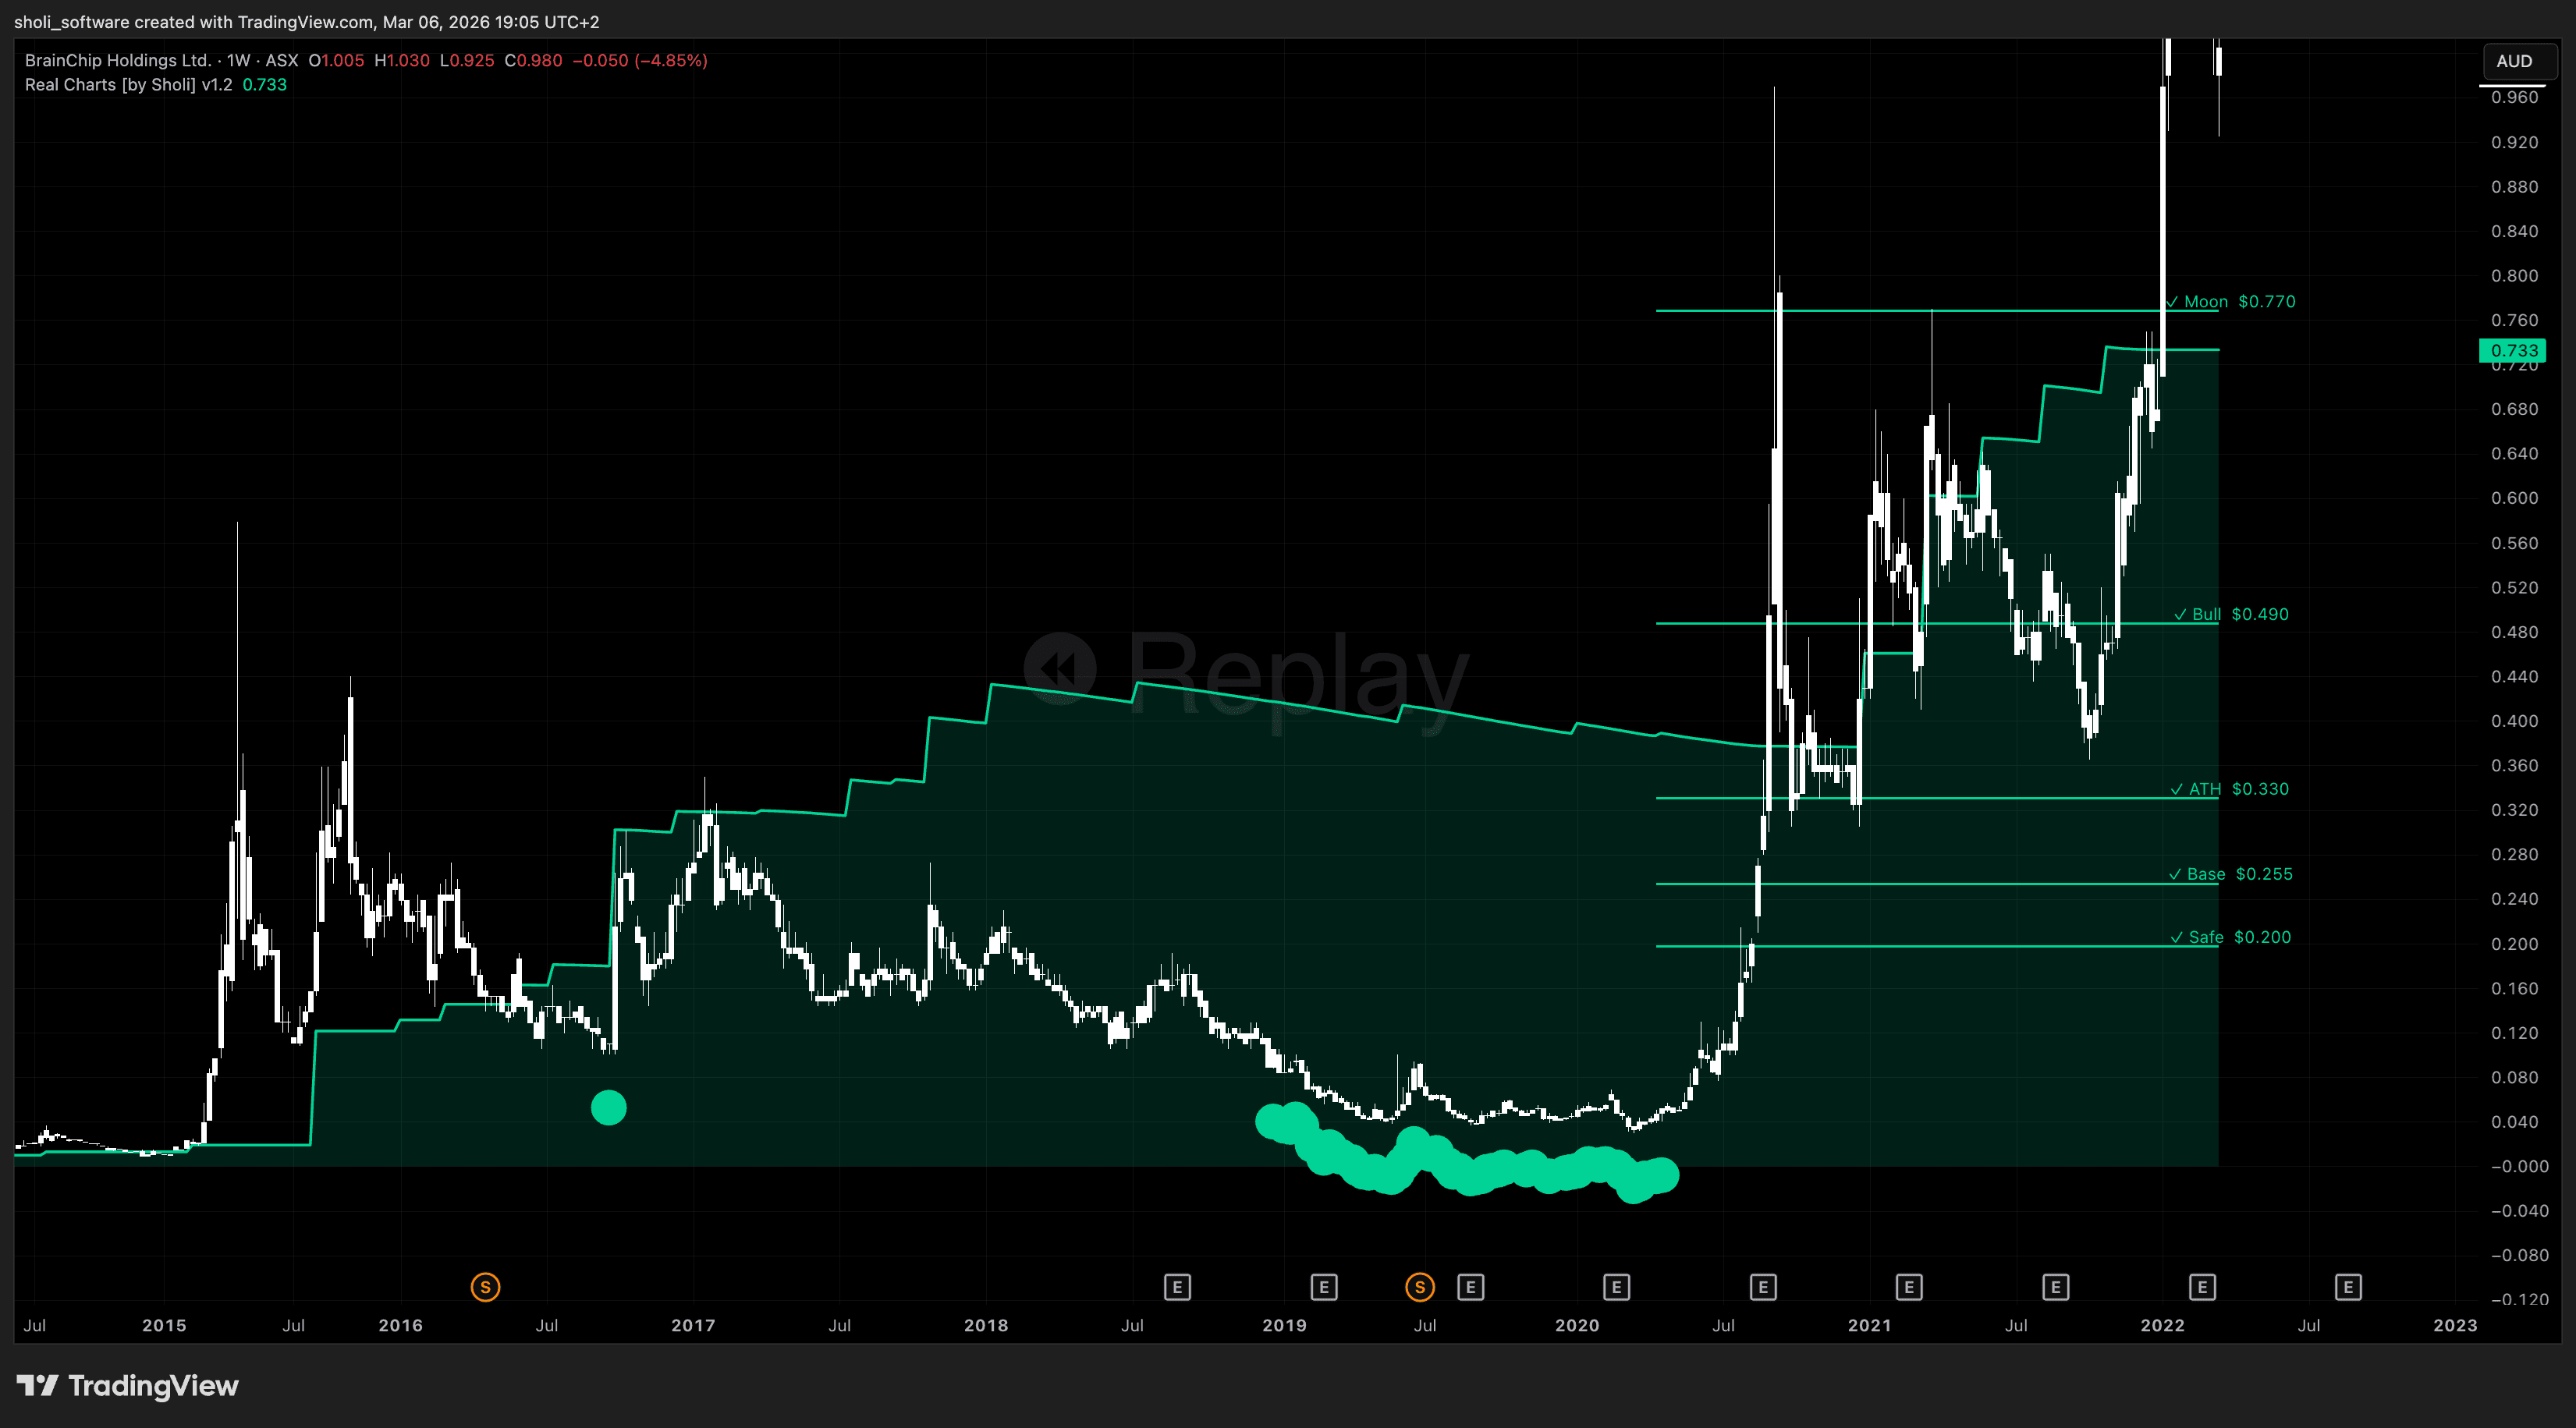
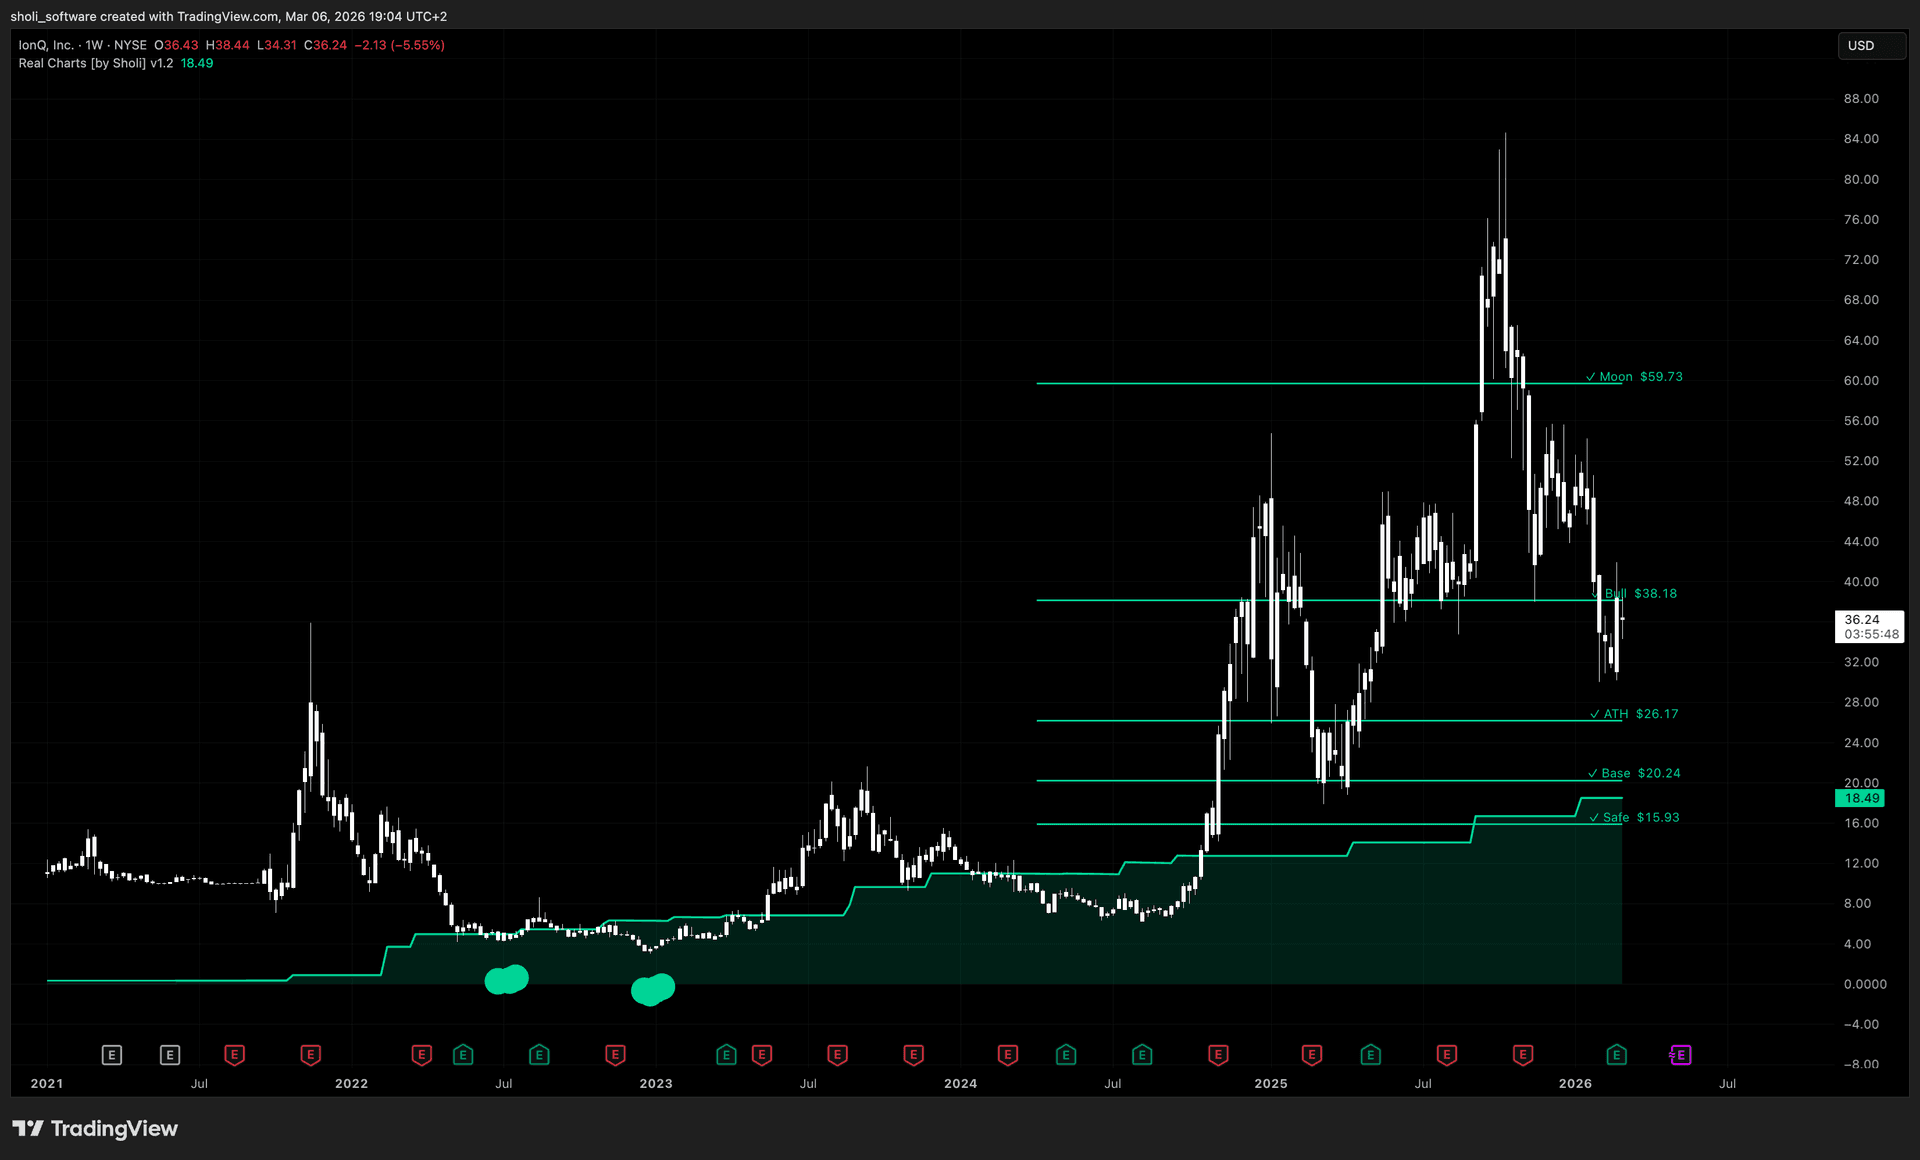
Value Zone
See when price is at fair value.
The green zone is a dynamic fair value range calculated from historical data. When price enters this zone, the asset may be trading at undervalued levels. The upper edge — the fair price line — adapts as market conditions evolve.
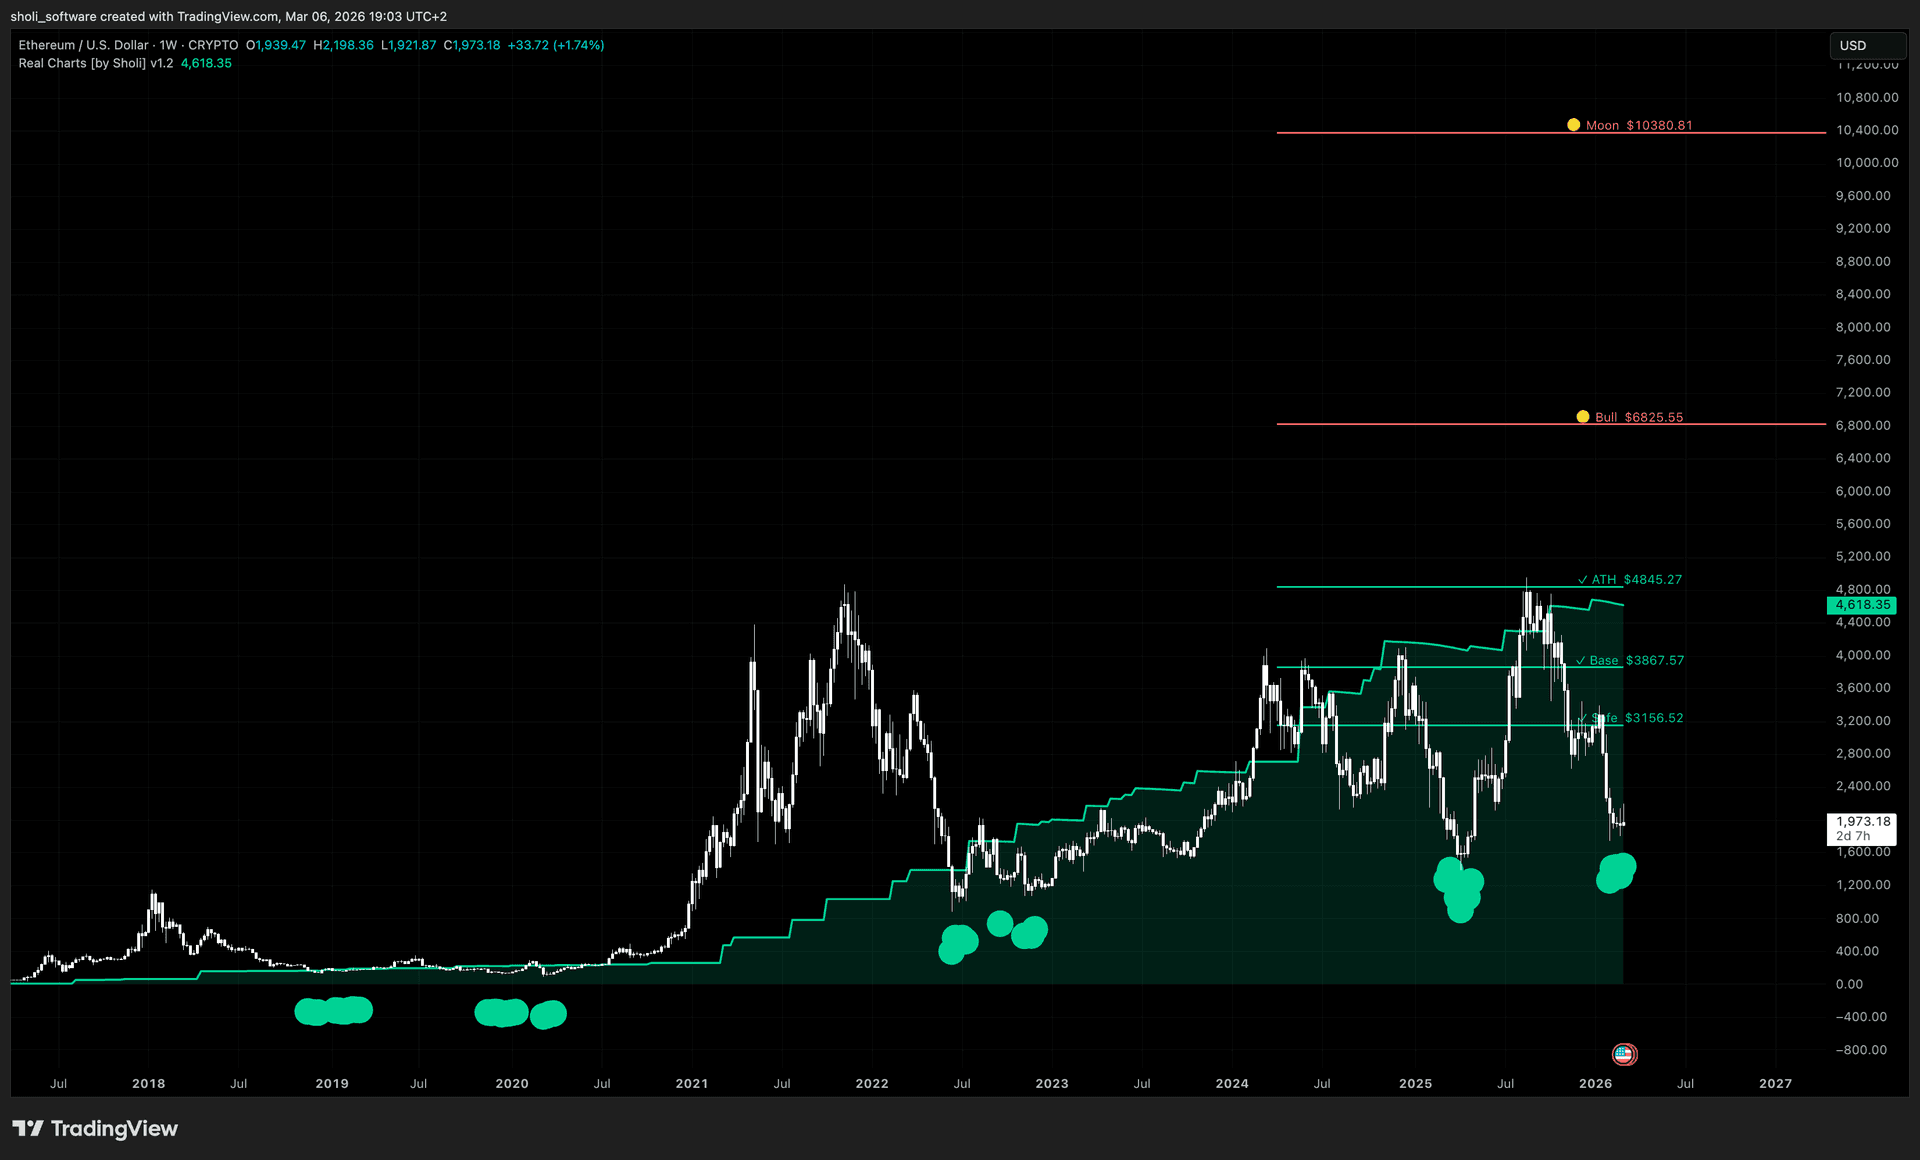
Filtered Entry Signals
Wait for conditions to align.
Green circles appear below candles when the internal filtering system confirms that multiple bullish conditions are present at the same time. Signals confirm at bar close — they don't repaint and they don't disappear.

Price Predictions
Know where the price could go.
Five target lines — Safe, Base, ATH, Bull, Moon — serve as potential profit-taking references. Lines turn green when a target is reached.
What changes.
Without
With Real Charts
Guessing if the price is fair
Calculated fair value zone from historical data
Entering based on a single indicator
Filtered signals that require multiple conditions
No framework for upside potential
Five price targets: Safe, Base, ATH, Bull, Moon
Signals that repaint or disappear
Every signal confirms at bar close permanently
Switching between multiple overlays
Zone, signals, targets, and fair price line in one
The details.
Zero repainting
Signals confirm at bar close. They don't change, move, or disappear after the fact.
Any asset
Stocks and crypto. Any ticker with enough historical data on TradingView.
One overlay
Fair value zone, entry signals, price targets, fair price line — all in a single indicator.
Invite-only on TradingView
Subscribe, provide your TradingView username. Access is activated on your account.
Free demo available
Try it on BTC, ETH, SOL, TSLA, MSTR and more. No payment required.
Data over emotion.
The fair price exists. Now you can see it.
Real Charts is an analytical tool for educational and informational purposes. It does not constitute financial advice. All trading decisions are yours.